stringtranslate.com

List of Malaysian states by GDP

This is a list of Malaysian states and federal territories sorted by their gross domestic product (GDP).[1][2]

As of 3 November 2022 Malaysian Ringgit (symbol: RM, currency code: MYR) is equivalent to 0.211 United States dollar[3] or 0.213 Euros.[4]

In 2023, Selangor contributed 25.9% of Malaysia's GDP, followed by Kuala Lumpur (15.9%) and Johor (9.5%).[5] GDP per capita also varied widely across the country, with Kuala Lumpur, Labuan, Penang and Sarawak classified as high-income economies as of 2022.[6]

Gross Domestic Product by state

Malaysian states by GDP (nominal US$) in 2020.
National GDP is 364,681 US$.
  < 100,000 US$ (278,481 I$)
  100,000 - < 1,000,000 US$ (278,481 - < 2,784,810 I$)
  1,000,000 - < 5,000,000 US$ (2,784,810 - < 13,924,050 I$)
  5,000,000 - < 10,000,000 US$ (13,924,050 - < 27,848,101 I$)
  10,000,000 - < 45,000,000 US$ (27,848,101- < 125,316,455 I$)
  45,000,000 - < 60,000,000 US$ (125,316,455 - < 167,088,608 I$)
  > 60,000,000 US$ (> 167,088,608 I$)

The following table is the list of the GDP of Malaysian states released by the Department of Statistics Malaysia.[7][8]

Data for 2023 estimates (US$ 1 = MYR 4.56 at 2023 average market exchange rate,[9] international $ (I$) using 2023 PPP conversion factor from World Bank (I$ 1 = MYR1.43) [10])
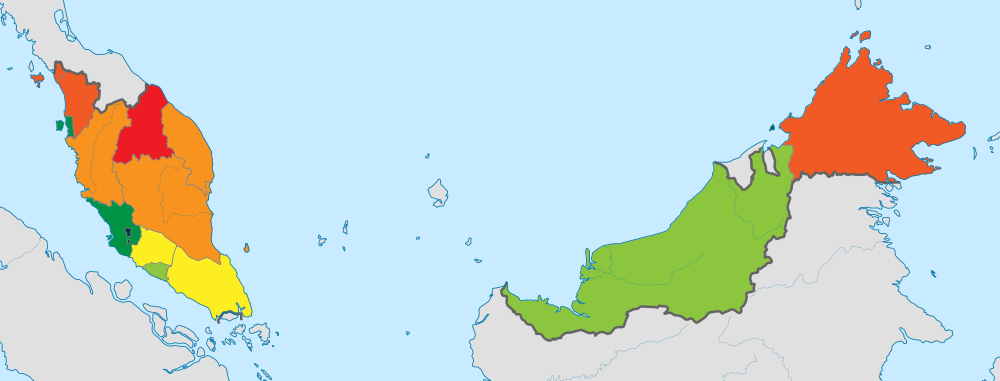
Gross Domestic Product per capita by state

Malaysian states by GDP per capita (nominal US$) in 2020.
National average is 11,281 US$.
  < 5,000 US$ (< 13,924 I$)
  5,000 - < 7,000 US$ (13,924 - < 19,494 I$)
  7,000 - < 9,000 US$ (19,494 - < 25,063 I$)
  9,000 - < 11,281 US$ (25,063 - < 31,415 I$)
  11,281 - < 13,000 US$ (31,415- < 36,203 I$)
  13,000 - < 15,000 US$ (36,203 - < 41,772 I$)
  15,000 - < 20,000 US$ (41,772 - < 55,696 I$)
  > 20,000 US$ (> 55,696 I$)

The following table is a list of the GDP per capita of Malaysian states released by the Department of Statistics Malaysia. Data for 2023 estimates (US$ at 2023 average market exchange rate,[14] international $ (I$) using 2023 PPP conversion factor from World Bank[15])


See also

References

  1. ^ "Table 30: GDP by State, 2010-2016 at Current Prices - RM Million" (PDF) (in Malay and English). Department of Statistics, Malaysia. p. 17/32. Retrieved 22 February 2018.
  2. ^ "Table 2.6.2: Gross Domestic Product by State at Constant Prices (2010 = 100), 2010 - 2016, Malaysia" (PDF) (in Malay and English). Economic Planning Unit, Prime Minister's Department of Malaysia. p. 1/2. Archived from the original (PDF) on 21 April 2017. Retrieved 22 February 2018.
  3. ^ "XE: MYR / USD Currency Chart. Malaysian Ringgit to US Dollar Rates". www.xe.com. Retrieved 4 January 2021.
  4. ^ "XE: MYR / EUR Currency Chart. Malaysian Ringgit to Euro Rates". www.xe.com. Retrieved 4 January 2021.
  5. ^ Lam, Seng Fatt (2 July 2024). "Selangor records 25.9% contribution to 2023 national GDP — DOSM". The Edge. Retrieved 23 July 2024.
  6. ^ "Sarawak now a high-income state, says World Bank lead economist". Malaysian Investment Development Authority. 6 July 2023. Retrieved 23 July 2024.
  7. ^ "Department of Statistics Malaysia Official Portal". www.dosm.gov.my. Retrieved 30 September 2020.
  8. ^ "Department of Statistics Malaysia Official Portal". www.dosm.gov.my. Retrieved 30 October 2021.
  9. ^ "Official exchange rate (LCU per US$, period average)". data.worldbank.org. Retrieved 12 July 2023.
  10. ^ "World Bank Open Data: PPP conversion factor, GDP (LCU per international $)". data.worldbank.org. Retrieved 12 July 2023.
  11. ^ "Department of Statistics Malaysia Official Portal". www.dosm.gov.my. Retrieved 2 July 2024.
  12. ^ "Department of Statistics Malaysia Official Portal". www.dosm.gov.my. Retrieved 30 June 2023.
  13. ^ "Department of Statistics Malaysia Official Portal". www.dosm.gov.my. Retrieved 8 November 2022.
  14. ^ "Official exchange rate (LCU per US$, period average)". data.worldbank.org. Retrieved 12 July 2023.
  15. ^ "World Bank Open Data: PPP conversion factor, GDP (LCU per international $)". data.worldbank.org. Retrieved 12 July 2023.