Cartography (/kɑːrˈtɒɡrəfi/; from Ancient Greek: χάρτης chartēs, 'papyrus, sheet of paper, map'; and γράφειν graphein, 'write') is the study and practice of making and using maps. Combining science, aesthetics and technique, cartography builds on the premise that reality (or an imagined reality) can be modeled in ways that communicate spatial information effectively.
The fundamental objectives of traditional cartography are to:
Modern cartography constitutes many theoretical and practical foundations of geographic information systems (GIS) and geographic information science (GISc).

What is the earliest known map is a matter of some debate, both because the term "map" is not well-defined and because some artifacts that might be maps might actually be something else. A wall painting that might depict the ancient Anatolian city of Çatalhöyük (previously known as Catal Huyuk or Çatal Hüyük) has been dated to the late 7th millennium BCE.[1][2] Among the prehistoric alpine rock carvings of Mount Bego (France) and Valcamonica (Italy), dated to the 4th millennium BCE, geometric patterns consisting of dotted rectangles and lines are widely interpreted[3][4] in archaeological literature as depicting cultivated plots.[5] Other known maps of the ancient world include the Minoan "House of the Admiral" wall painting from c. 1600 BCE, showing a seaside community in an oblique perspective, and an engraved map of the holy Babylonian city of Nippur, from the Kassite period (14th – 12th centuries BCE).[6] The oldest surviving world maps are from 9th century BCE Babylonia.[7] One shows Babylon on the Euphrates, surrounded by Assyria, Urartu[8] and several cities, all, in turn, surrounded by a "bitter river" (Oceanus).[9] Another depicts Babylon as being north of the center of the world.[7]

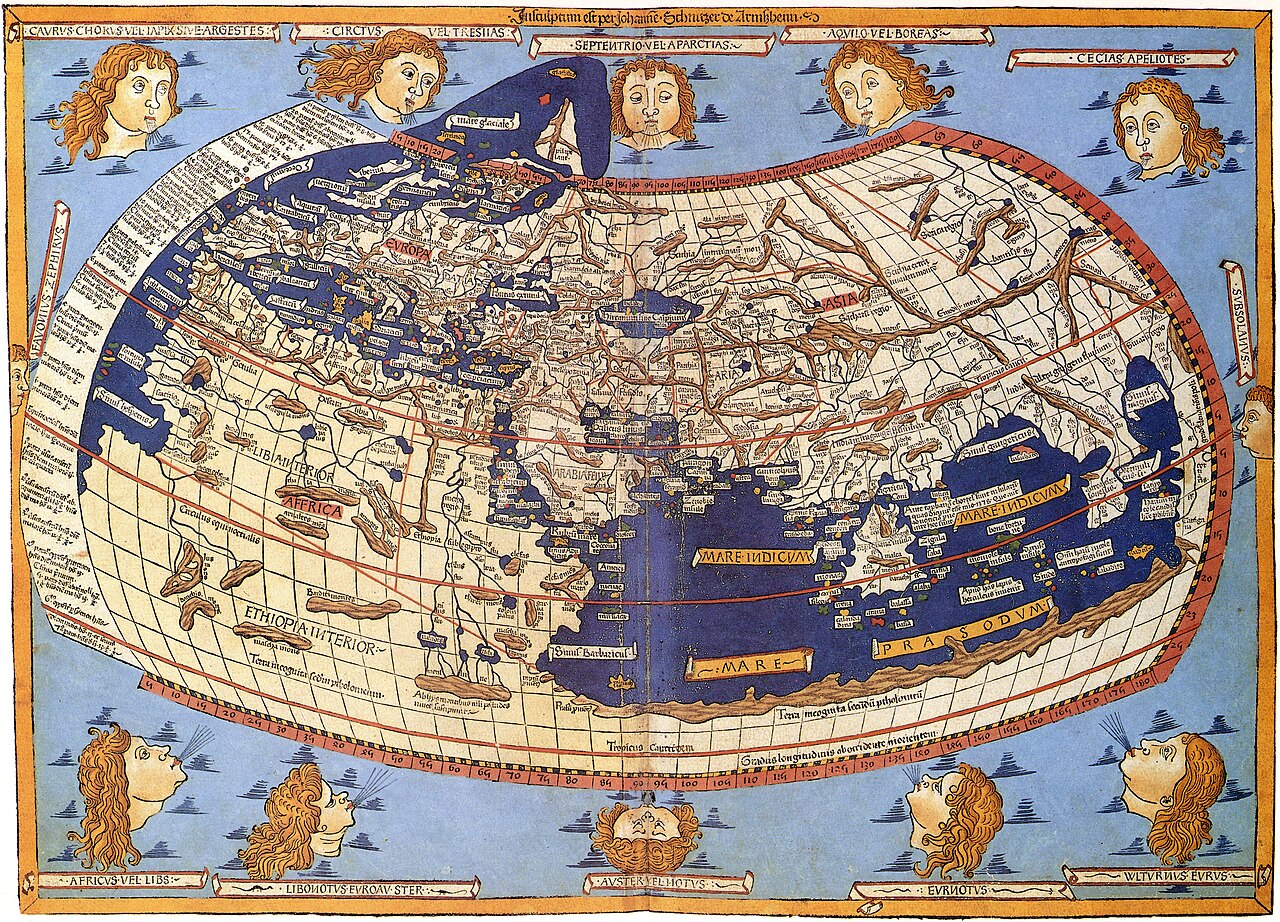
The ancient Greeks and Romans created maps from the time of Anaximander in the 6th century BCE.[10] In the 2nd century CE, Ptolemy wrote his treatise on cartography, Geographia.[11] This contained Ptolemy's world map – the world then known to Western society (Ecumene). As early as the 8th century, Arab scholars were translating the works of the Greek geographers into Arabic.[12] Roads were essential in the Roman world, motivating the creation of maps, called itinerarium, that portrayed the world as experienced via the roads. The Tabula Peutingeriana is the only surviving example.

In ancient China, geographical literature dates to the 5th century BCE. The oldest extant Chinese maps come from the State of Qin, dated back to the 4th century BCE, during the Warring States period. In the book Xin Yi Xiang Fa Yao, published in 1092 by the Chinese scientist Su Song, a star map on the equidistant cylindrical projection.[13][14] Although this method of charting seems to have existed in China even before this publication and scientist, the greatest significance of the star maps by Su Song is that they represent the oldest existent star maps in printed form.
Early forms of cartography of India included depictions of the pole star and surrounding constellations.[15] These charts may have been used for navigation.[15]

Mappae mundi ('maps of the world') are the medieval European maps of the world. About 1,100 of these are known to have survived: of these, some 900 are found illustrating manuscripts, and the remainder exist as stand-alone documents.[16]

The Arab geographer Muhammad al-Idrisi produced his medieval atlas Tabula Rogeriana (Book of Roger) in 1154. By combining the knowledge of Africa, the Indian Ocean, Europe, and the Far East (which he learned through contemporary accounts from Arab merchants and explorers) with the information he inherited from the classical geographers, he was able to write detailed descriptions of a multitude of countries. Along with the substantial text he had written, he created a world map influenced mostly by the Ptolemaic conception of the world, but with significant influence from multiple Arab geographers. It remained the most accurate world map for the next three centuries.[17][18] The map was divided into seven climatic zones, with detailed descriptions of each zone. As part of this work, a smaller, circular map depicting the south on top and Arabia in the center was made. Al-Idrisi also made an estimate of the circumference of the world, accurate to within 10%.[19]

In the Age of Discovery, from the 15th century to the 17th century, European cartographers both copied earlier maps (some of which had been passed down for centuries) and drew their own based on explorers' observations and new surveying techniques. The invention of the magnetic compass, telescope and sextant enabled increasing accuracy. In 1492, Martin Behaim, a German cartographer and advisor to the king John II of Portugal, made the oldest extant globe of the Earth.[20]
In 1507, Martin Waldseemüller produced a globular world map and a large 12-panel world wall map (Universalis Cosmographia) bearing the first use of the name "America." Portuguese cartographer Diogo Ribero was the author of the first known planisphere with a graduated Equator (1527). Italian cartographer Battista Agnese produced at least 71 manuscript atlases of sea charts. Johannes Werner refined and promoted the Werner projection. This was an equal-area, heart-shaped world map projection (generally called a cordiform projection) that was used in the 16th and 17th centuries. Over time, other iterations of this map type arose; most notable are the sinusoidal projection and the Bonne projection. The Werner projection places its standard parallel at the North Pole; a sinusoidal projection places its standard parallel at the equator; and the Bonne projection is intermediate between the two.[21][22]
In 1569, mapmaker Gerardus Mercator first published a map based on his Mercator projection, which uses equally-spaced parallel vertical lines of longitude and parallel latitude lines spaced farther apart as they get farther away from the equator. By this construction, courses of constant bearing are conveniently represented as straight lines for navigation. The same property limits its value as a general-purpose world map because regions are shown as increasingly larger than they actually are the further from the equator they are. Mercator is also credited as the first to use the word "atlas" to describe a collection of maps. In the later years of his life, Mercator resolved to create his Atlas, a book filled with many maps of different regions of the world, as well as a chronological history of the world from the Earth's creation by God until 1568. He was unable to complete it to his satisfaction before he died. Still, some additions were made to the Atlas after his death, and new editions were published after his death.[23][24]
In 1570, the Brabantian cartographer Abraham Ortelius, strongly encouraged by Gillis Hooftman, created the first true modern atlas, Theatrum Orbis Terrarum.[25] In a rare move, Ortelius credited mapmakers who contributed to the atlas, the list of which grew to 183 individuals by 1603.[26]
In the Renaissance, maps were used to impress viewers and establish the owner's reputation as sophisticated, educated, and worldly. Because of this, towards the end of the Renaissance, maps were displayed with equal importance of painting, sculptures, and other pieces of art.[27] In the sixteenth century, maps were becoming increasingly available to consumers through the introduction of printmaking, with about 10% of Venetian homes having some sort of map by the late 1500s.
There were three main functions of maps in the Renaissance:[28]
In medieval times, written directions of how to get somewhere were more common than the use of maps. With the Renaissance, cartography began to be seen as a metaphor for power.[28] Political leaders could lay claim to territories through the use of maps, and this was greatly aided by the religious and colonial expansion of Europe. The Holy Land and other religious places were the most commonly mapped during the Renaissance.
In the late 1400s to the late 1500s, Rome, Florence, and Venice dominated map-making and trade. It started in Florence in the mid-to late 1400s. Map trade quickly shifted to Rome and Venice but then was overtaken by atlas makers in the late 16th century.[29] Map publishing in Venice was completed with humanities and book publishing in mind, rather than just informational use.
There were two main printmaking technologies in the Renaissance: woodcut and copper-plate intaglio, referring to the medium used to transfer the image onto paper.
In woodcut, the map image is created as a relief chiseled from medium-grain hardwood. The areas intended to be printed are inked and pressed against the sheet. Being raised from the rest of the block, the map lines cause indentations in the paper that can often be felt on the back of the map. There are advantages to using relief to make maps. For one, a printmaker doesn't need a press because the maps could be developed as rubbings. Woodblock is durable enough to be used many times before defect