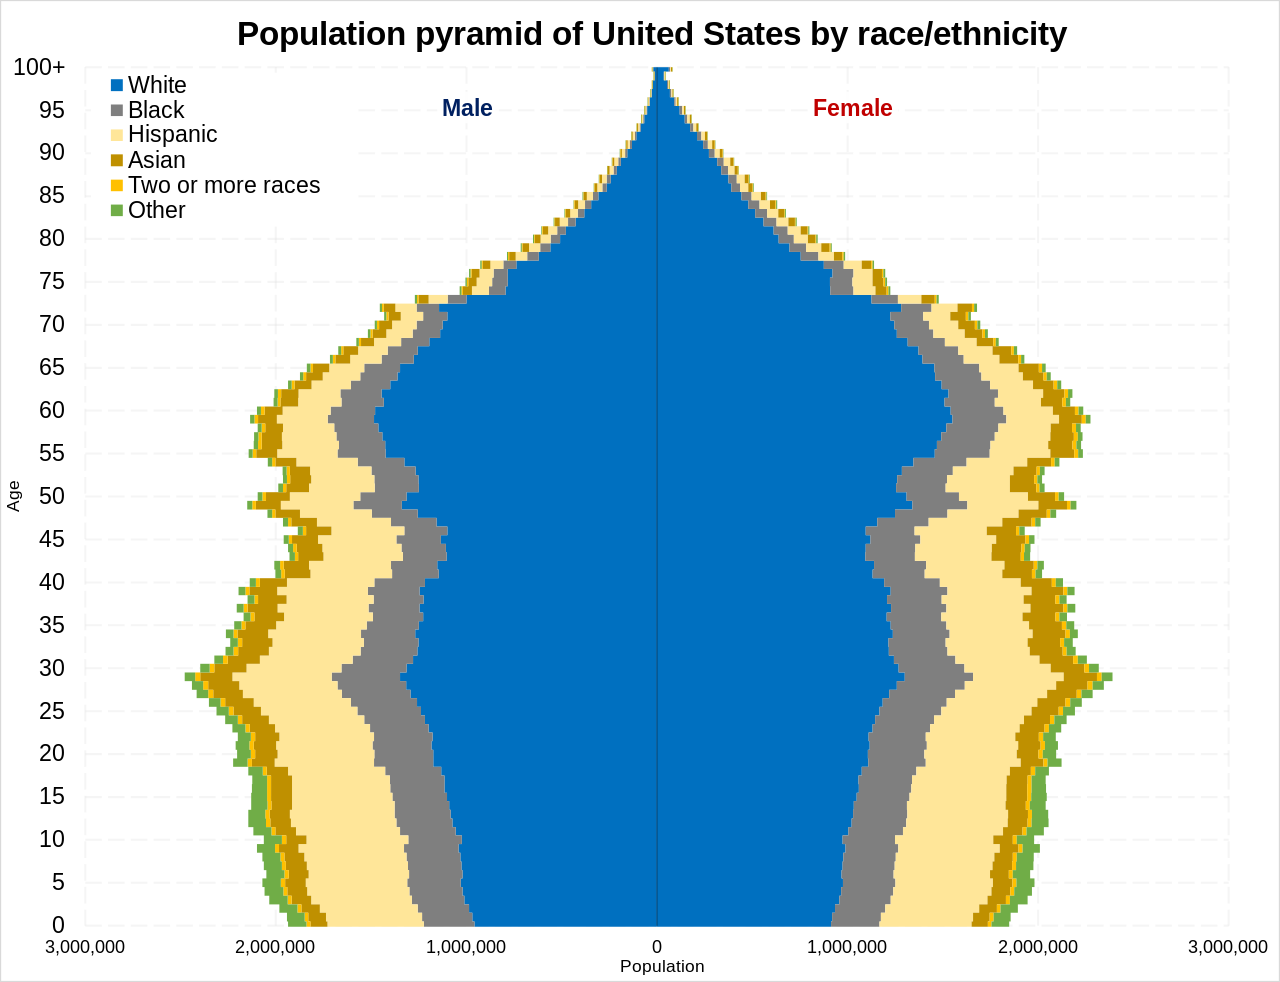
В Соединенных Штатах проживает расово и этнически разнообразное население. [1] На федеральном уровне раса и этническая принадлежность классифицируются отдельно. Самая последняя перепись населения США признала пять расовых категорий ( белые , черные , коренные американцы / коренные жители Аляски , азиаты и коренные гавайцы / другие жители островов Тихого океана ), а также людей, принадлежащих к двум или более расовым категориям . [2] [3] [4] Соединенные Штаты также признают более широкое понятие этнической принадлежности. Перепись 2000 года и Исследование американского сообщества 2010 года касались «происхождения» жителей, а перепись 2020 года позволила людям указать свое «происхождение». [5] Бюро переписи населения также классифицировало респондентов как латиноамериканцев или латиноамериканцев , идентифицируя их как этническую принадлежность , которая составляет группу меньшинства в стране. [2] [3] [4]
Белые американцы составляют большинство во всех определенных переписью регионах ( Северо-Восток , Средний Запад , Юг и Запад ) и в 44 из 50 штатов, за исключением Гавайев , [6] Калифорнии , [7] Техаса , [8] Нью-Мексико , [9] Невада , [10] и Мэриленд . [11] Те, кто идентифицирует себя как белые отдельно или в сочетании (включая многорасовых белых американцев), составляют большинство во всех штатах, кроме Гавайев. [12] Регионом с самой высокой долей белых американцев является Средний Запад с 74,6% согласно опросу американского сообщества (ACS), за которым следует Северо-Восток с 64%. [13] [14] Белые неиспаноязычные составляют 73% населения Среднего Запада, это самая высокая доля среди всех регионов, и они составляют 62% населения Северо-Востока. [15] [16] В то же время регионами с наименьшей долей белых американцев являются Запад , где они составляют 51,9%, и Юг , где они составляют 57,7%. [17] [18] Белые неиспаноязычные составляют меньшинство на Западе, где они составляют 47,1% населения. [19] На Юге белые неиспаноязычные составляют 54% населения. [20]
В настоящее время 55% афроамериканского населения проживает на Юге. [4] Большинство или большинство других официальных групп проживают на Западе. В последнем регионе проживают 42% латиноамериканцев и латиноамериканцев, 46% американцев азиатского происхождения, 48% американских индейцев и коренных жителей Аляски, 68% коренных жителей Гавайских островов и других жителей островов Тихого океана, 37% населения «двух или более рас». (многорасовые американцы), и 46% из них назвали себя «какой-то другой расой». [4] [21]
Каждая из пяти населенных территорий США довольно однородна, хотя каждая из них включает в себя разные основные этнические группы. В Американском Самоа проживает высокий процент жителей островов Тихого океана, на Гуаме и Северных Марианских островах проживают в основном жители азиатских и тихоокеанских островов, в Пуэрто-Рико проживают в основном выходцы из Латинской Америки/латиноамериканцы, а на Виргинских островах США в основном проживают афроамериканцы. [22] [23] [24] [25]
The first United States census in 1790 classed residents as free White people (divided by age and sex), all other free persons (reported by sex and color), and enslaved people. The 2000 census officially recognized six racial categories including people of two or more races; a category called "some other race" was also used in the census and other surveys, but is not official.[2][3][4] In the 2000 census and subsequent Census Bureau surveys, Americans self-described as belonging to these racial groups:[3]
В ходе переписи людей спрашивают об их расовой принадлежности, включая их происхождение, а также о том, принадлежат ли они к латиноамериканской национальности. [32] Эти категории являются социально-политическими конструкциями и не должны интерпретироваться как имеющие научный или антропологический характер. [2] Они менялись от одной переписи к другой, а расовые категории включают группы как «расового», так и национального происхождения. [33] [34]
В 2007 году Комиссия по равным возможностям трудоустройства Министерства труда США завершила обновление формата своего отчета EEO-1 [35] и рекомендаций, касающихся определений расовых или этнических категорий.
В марте 2024 года Административно-бюджетное управление опубликовало поправки к Директиве о статистической политике № 15: Стандарты хранения, сбора и представления федеральных данных о расовой и этнической принадлежности, которые касаются: (1) комбинированного вопроса о расовой и этнической принадлежности; (2) добавление категории «Ближний Восток или Северная Африка (MENA)»; и (3) сбор дополнительной информации для обеспечения дезагрегирования данных. [36] [37]
Вопрос о латиноамериканском или латиноамериканском происхождении отделен от вопроса о расе. [3] [38] Латиноамериканцы и латиноамериканцы имеют этническое происхождение из испаноязычной страны или Бразилии . Страны Латинской Америки, как и США, отличаются расовым разнообразием. [39] Следовательно, для латиноамериканцев и латиноамериканцев не существует отдельной расовой категории, поскольку они не составляют расу или национальную группу. При ответе на вопрос о расе в форме переписи каждому человеку предлагается выбрать одну из тех же расовых категорий, что и все американцы, и он включается в число, сообщаемое по этим расам. [40]
В каждую расовую категорию могут входить неиспаноязычные или латиноамериканцы, а также латиноамериканцы или латиноамериканцы . Например: расовая категория «Белые» или «Европейско-американские» включает белых неиспаноязычных и белых латиноамериканцев (см. «Белые латиноамериканцы и латиноамериканцы »); категория «Черные или афроамериканцы» включает чернокожих неиспаноязычных и чернокожих латиноамериканцев (см. Черные латиноамериканцы и латиноамериканцы ); Категория американцев азиатского происхождения включает выходцев из Азии и Латинской Америки (см. «Латиноамериканцы азиатского происхождения и латиноамериканцы »), а также для всех остальных категорий.
Самоидентификация как латиноамериканца или латиноамериканца , но не как латиноамериканца или латиноамериканца, не разрешена и не запрещена явно. [2]
Поскольку концепция расы получила широкое распространение в ранних Соединенных Штатах, люди индейского , африканского и европейского происхождения считались принадлежащими к разным расам. На протяжении почти трех столетий критерии членства в этих группах были схожими; Внешний вид человека, его круг общения (то, как он жил) и происхождение учитывались обществом при определении чьей-либо расы.
The motivations behind historical definitions of racial identity, especially Native American and black identities, have been the topic of much discussion in modern years. According to many anthropologists, these racial designations were a means to concentrate power, wealth, privilege and land in the hands of white people in a society of white hegemony and privilege. Racial distinctions generally had little to do with biology and more to do with the history of slavery, the systemic racism it produced, and specific forms of white supremacy that benefited from specific definitions of racial identity. For example, it has been suggested that the blood quantum laws defining Native American identity enabled whites to acquire indigenous lands during the allotment process, and the one-drop rule of black identity, enforced legally in the early 20th century, enabled them to preserve their agricultural labor force in the South.
The descendants of Native and Black Americans not only had to contend with laws defining their racial identity for the benefit of the majority, but also with a variety of social consequences depending on how they were perceived in society. Compared to other mixed Americans, the blood quantum laws made it easier for a person of mixed European and Native American ancestry to be accepted as white; after a few generations of intermarriage, the offspring of Native and White Americans would no longer legally be considered Native American. They could have treaty rights to land, but because an individual with only one native great-grandparent was no longer was classified as Native American, they lost legal claim to their land under historical allotment rules, making it easier for White Americans to acquire the land for their own development. On the other hand, the same individual who could be denied legal standing in a tribe because he was "too White" to claim property rights might still have enough visually identifiable native ancestry to be considered socially as a "half-breed" and stigmatized by both communities.
The 20th century one-drop rule made it relatively difficult for anyone of known black ancestry to be accepted as white. The child of a black sharecropper and a white person was considered black by the local communities, and would likely become a sharecropper as well, thus adding to the landholder or employer's labor force. Because the agricultural economy of the time benefited from using Black Americans as a labor force, it was advantageous for as many people as possible to be defined as black. Many experts on the Jim Crow period agree that the 20th century notion of invisible blackness shifted the color line in the direction of paleness, and "expanded" the labor force in response to Southern blacks' Great Migration to the North, although others (such as the historians C. Vann Woodward, George M. Fredrickson, and Stetson Kennedy) considered the one-drop rule a consequence of the need to justify the oppression of Black Americans and define whiteness as pure.
Over the centuries, as whites wielded social and political power over people of color in the United States, they created a social order of hypodescent, in which they assigned mixed-race children to the lower-status groups. However, they were often ignorant of the systems of social classification within Native American tribes. The Omaha people, for instance, who had a patrilineal kinship system, classified all children with white fathers as "White", and excluded them as members of the tribe unless they were formally adopted by a male member. Tribal members might care for mixed-race children of White fathers, but they were considered outside the hereditary clan and kinship fundamental to tribal society.[41]
Социальная конструкция гиподесцента также связана с расовой кастовой системой, связанной с рабством. Это было ясно сформулировано в законах Вирджинии и других колоний еще в 1662 году. Вирджиния включила римский принцип partus sequitur ventrem в рабское право, заявив, что дети порабощенных матерей также рождаются в рабстве. Согласно английскому общему праву социальный статус детей определялся отцом, а не матерью, но колонисты считали порабощенных африканцев вне категории английских подданных. Хотя белые мужчины имели власть и могли использовать сексуальные преимущества над порабощенными чернокожими женщинами, это означало, что их потомки будут считаться черными и будут порабощены независимо от их происхождения. Однако большинство свободных чернокожих американских семей, перечисленных в переписях 1790–1810 годов, произошли от союзов между белыми женщинами и африканскими мужчинами в колониальной Вирджинии, в те годы, когда рабочие классы жили и работали тесно вместе, и до того, как рабство закрепилось как расовая каста. . [42]
В Соединенных Штатах социальные и юридические конвенции, разработанные с течением времени белыми, классифицировали людей смешанного происхождения по упрощенным расовым категориям, но они всегда были ошибочными. Десятилетние переписи населения, проводимые с 1790 года, после того как рабство прочно утвердилось в Соединенных Штатах, включали классификацию людей по расе с категориями «белый», «черный», « мулат » и «индеец». Включение мулата было редким явным признанием людей смешанной расы, но в реальном обществе этот статус обычно упрощался до той или иной расы. До Гражданской войны в таких штатах, как Вирджиния, существовало юридическое определение белизны, которое классифицировало людей как белых, если они не более чем на 1/8 были черными. Например, если бы дети Томаса Джефферсона от его рабыни Салли Хемингс не родились в рабстве, они были бы классифицированы как юридически белые, поскольку по происхождению они были на 7/8 белых. Трое из четырех выживших детей вошли в белое общество уже взрослыми, и их потомки идентифицировали себя как белые. В конце 18-го и 19-го веков люди смешанной расы часто мигрировали в приграничные районы, где общества были более открытыми, и их могли принять как белых, если они выполняли обязательства гражданства. [42]
The more familiar "one-drop rule" was not adopted by Virginia and other states until the 20th century, but it classified persons with any known African ancestry as black. Passage of these laws was often encouraged by white supremacists and people promoting "racial purity", who disregarded the long history of multi-racial unions in the South.[43] In other countries in the Americas, where mixing among groups was overtly more extensive, social categories have tended to be more numerous and fluid. In some cases, people may move into or out of categories on the basis of a combination of socioeconomic status, social class, ancestry, and appearance.
The term Hispanic as an ethnonym emerged in the 20th century, with the rise of migration of laborers from Spanish-speaking countries of the western hemisphere to the United States. It includes people who may have been considered racially distinct (black, white, native, or other mixed groups) in their home countries. Today, the word "Latino" is often used as a synonym for "Hispanic". Even if such categories were earlier understood as racial categories, today they have begun to represent ethnolinguistic categories, regardless of perceived race. Similarly, the prefix "Anglo" is now used among some Hispanics to refer to non-Hispanic White Americans or European Americans, most of whom speak the English language but are not of primarily English descent. A similar phenomenon of ethnolinguistic identity can historically (and in some cases contemporarily) be seen in the case of the Louisiana Creole people, who may be of any race but share certain cultural characteristics.
The growth of the Hispanic population through immigration and high birth rates is noted as a partial factor for U.S. population gains in the last quarter-century. The 2000 census revealed that Native Americans had reached their highest documented population, 4.5 million, since the U.S. was founded in 1776.[3] In some cases, immigrants and migrants have formed ethnic enclaves; in others, this mixture of races has created ethnically diverse communities. Earlier immigrants to the Americas came from widely separated regions of Afro-Eurasia, and American immigrant populations frequently mixed among themselves and with the indigenous inhabitants of the continents, creating a complex multiracial population.
Throughout American history, efforts to classify the increasingly mixed population of the United States into discrete categories have generated many difficulties. Early efforts to track mixing between groups led to a proliferation of historical categories (such as "mulatto" and "octaroon" among persons with partial African descent) and "blood quantum" distinctions, which became increasingly detached from self-reported ancestry. By the standards used in early censuses, many mixed-race children born in the U.S. were classified as of a different race than one of their biological parents, and even when these standards were no longer commonly accepted, the combination of social perceptions of race and self-identification with a racial identity frequently complicated legal standards of racial identity. Even people who did not identify as mixed faced the issue of unclear legal terminology; until the 2000 census, Hispanic Americans were required to identify as one race on censuses, and without the option to select Latino or Hispanic, confusion flourished.
Historical trends influencing the ethnic demographics of the United States include:
For demographics by specific ethnic groups rather than general race, see "Ancestry" below.
_from_1960_to_2020.gif/1280px-White_America_(of_one_race)_from_1960_to_2020.gif)
White and European Americans are the majority of people living in the United States. White people are defined by the United States Census Bureau as those "having origins in any of the original peoples of Europe, the Middle East, or North Africa".[45] Like all official U.S. racial categories, "White" has a "not Hispanic or Latino" and a "Hispanic or Latino" component,[46] the latter consisting mostly of White Mexican Americans and White Cuban Americans.
По состоянию на 2022 год белые американцы составляют большинство во всех регионах, определенных переписью ( Северо-Восток , Средний Запад , Юг и Запад ) и в 44 из 50 штатов. Белые американцы одной расы не составляют большинства в штатах Гавайи , [6] Калифорния , [7] Техас , [8] Нью-Мексико , [9] Невада , [10] и Мэриленд , а также в американском округе Колумбия . Самоа , Гуам , Северные Марианские острова , Пуэрто-Рико , [47] и Виргинские острова США . [48] [49] Однако те, кто идентифицирует себя как белые отдельно или в сочетании (включая многорасовых белых американцев), составляют большинство в каждом штате, кроме Гавайев, а также составляют большинство на территории Пуэрто-Рико. [12] По данным переписи населения США 2020 года , белые неиспаноязычные составляют большинство в 44 штатах, за исключением Калифорнии , Гавайев , Мэриленда , Невады , Нью-Мексико , Техаса , округа Колумбия, Американского Самоа, Гуама, Северных Марианских островов, Пуэрто-Рико и Виргинские острова США. [50] [51] [48] [52] [49] [53]
Процент неиспаноязычных белых в 50 штатах и округе Колумбия (60,1% в 2019 г.) [54] снижается с середины 20-го века в результате изменений, внесенных в иммиграционную политику, в первую очередь Закона Харта-Селлера о 1965. Если нынешние тенденции сохранятся, к 2050 году доля белых неиспаноязычных людей упадет ниже 50% от общей численности населения США. Белые американцы в целом (белые неиспаноязычные вместе с белыми латиноамериканцами , а также многие из тех , реклассифицируются как белые для прогнозов Бюро переписи населения, поскольку эта категория не признается Управлением управления и бюджета [55] [56] ), по прогнозам, по-прежнему будет составлять большинство, на уровне 72,6% (или 264 миллиона из 364 миллионов) в 2060 г., с нынешних 75,5%. [57]
Although a high proportion of the population is known to have multiple ancestries, in the 2000 U.S. census, the first with the option to choose more than one, most people still identified with one racial category.[citation needed] In the 2000 census, self-identified German Americans made up 17% of the U.S. population, followed by Irish Americans at 12%, as reported in the 2000 census. This makes German and Irish the largest and second-largest self-reported ancestry groups in the United States. Both groups had high rates of immigration to the U.S. beginning in the mid-19th century, triggered by the Great Famine in Ireland and the failed 1848 Revolution in Germany. English Americans and British Americans are still considered the largest ethnic group, despite the statistical errors caused by events such as the confusion in the 2000 census where many English and British Americans self-identified under the new category entry "American", thus considering themselves indigenous because their families had resided in the US for so long,[58][59][60][61] or, if of mixed European ancestry, identified with a more recent and differentiated ethnic group.[62] 7.2% of the population listed their ancestry as American on the 2000 census (see American ancestry). According to the U.S. Census Bureau, the number of people in the U.S. who reported American and no other ancestry increased from 12.4 million in 1990 to 20.2 million in 2000. This change in reporting represented the largest "growth" of any ethnic group in the United States during the 1990s, but it represented how people reported themselves more than growth through birth rates, for instance, and certainly did not reflect immigration.
Most French Americans are believed to be descended from colonists of Catholic New France; exiled Huguenots, much fewer in number and settling in the eastern English colonies in the late 1600s and early 1700s, needed to assimilate into the majority culture and have intermarried over generations. Some Louisiana Creoles, including the Isleños of Louisiana, and the Hispanos of the Southwest have had, in part, direct Spanish ancestry; most self-reported White Hispanics are of Mexican, Puerto Rican, Cuban, and Salvadoran origins,[63] each of which are multi-ethnic nations. Hispanic immigration has increased from nations of Central and South America.[64]
Есть значительное количество белых американцев восточно- и южноевропейского происхождения, таких как русские , поляки , итальянцы и американцы греческого происхождения . Восточноевропейцы иммигрировали в Соединенные Штаты позже, чем западноевропейцы. Арабы , турки , иранцы , израильтяне , армяне и другие выходцы из Западной Азии указаны в переписи населения США как белые в результате дела федерального суда от 1909 года, хотя большинство из них не идентифицируют себя как белые. [65]
По оценкам Бюро переписи населения США, в 2020 году насчитывалось 3,5 миллиона американцев Ближнего Востока, составляющих 1,06% населения [66] и включая американцев как арабского, так и неарабского происхождения. [67] Арабо -американский институт в 2014 году оценил численность населения в 3,6 миллиона человек. [68] Оценки населения переписи населения США основаны на ответах на вопрос о происхождении переписи, что затрудняет точный подсчет американцев Ближнего Востока. [68] [69] Хотя ближневосточные американские общины можно найти в каждом из 50 штатов, большинство из них проживает всего в 10 штатах; почти треть живут в Калифорнии, Нью-Йорке и Мичигане. [70] В Калифорнии проживает больше американцев Ближнего Востока, чем в любом другом штате, причем большой процент составляют такие этнические группы, как арабы, персы и армяне, но американцы Ближнего Востока представляют самый высокий процент населения Мичигана. [70] [71] В частности, Дирборн, штат Мичиган, уже давно является домом для высокой концентрации американцев Ближнего Востока. [72] [73]
The U.S. Census Bureau is still finalizing the ethnic classification of MENA populations. Middle Eastern Americans are currently counted as racially White on the census, although many do not identify as such. In 2012, prompted in part by post-9/11 discrimination, the American-Arab Anti-Discrimination Committee petitioned the Department of Commerce's Minority Business Development Agency to designate the MENA populations as a minority/disadvantaged community.[74] Following consultations with MENA organizations, the U.S. Census Bureau announced in 2014 that it would establish a new MENA ethnic category for populations from the Middle East, North Africa, and the Arab world, separate from the "white" classification that these populations had previously sought in 1909. The expert groups felt that the earlier "White" designation no longer accurately represents MENA identity, so they successfully lobbied for a distinct categorization.[28][75] This process does not currently include ethnoreligious groups such as Sikhs, as the Bureau only tabulates these groups as followers of religions rather than members of ethnic groups.[76]
According to the Arab American Institute, countries of origin for Arab Americans include Algeria, Bahrain, Egypt, Iraq, Jordan, Kuwait, Lebanon, Libya, Morocco, Oman, Qatar, Palestine, Saudi Arabia, Syria, Tunisia, United Arab Emirates, and Yemen. As of December 2015, the sampling strata for the new MENA category includes the Census Bureau's working classification of 19 MENA groups, as well as Armenian, Afghan, Iranian, Israeli, Azerbaijani, and Georgian groups.[77] The new category will identify "Israeli" as a choice and raises questions as to how the large U.S. Jewish population (7-8 million) will identify.[78]
The new question on the U.S. Census will identify the MENA category to include:[79]
Hispanic or Latino Population by race (2020):
Hispanic or Latino Americans number 59.8 million people, or 18.3% of the total U.S. population as of 2018.[81] The category includes people who are of full or partial Hispanic or Latino origin. They typically have origins in the Spanish-speaking nations of Latin America, although a few also come from other places (0.2% of Hispanic and Latino Americans were born in Asia, for example).[82] The group is heterogeneous in race and national ancestry.
The Census Bureau defines "Hispanic or Latino origin" thus:
For Census 2000, American Community Survey: People who identify with the terms "Hispanic" or "Latino" are those who classify themselves in one of the specific Hispanic or Latino categories listed on the Census 2000 or ACS questionnaire ("Mexican," "Puerto Rican," or "Cuban") as well as those who indicate that they are "other Spanish, Hispanic, or Latino". Origin can be viewed as the heritage, nationality group, lineage, or country of birth of the person, or the person's parents or ancestors, before their arrival in the United States. People who identify their origin as Spanish, Hispanic, or Latino may be of any race.[83]
Per the 2019 American Community Survey, the leading ancestries for Hispanic Americans are Mexican (37.2 million) followed by Puerto Rican (5.83 million), Cuban (2.38 million), and Salvadoran (2.31 million).[84] In addition, there are 3.19 million people living in Puerto Rico who are excluded from the count (see Puerto Ricans).
По состоянию на 2016 год численность латиноамериканцев и латиноамериканцев в Соединенных Штатах достигла 58 миллионов человек и является основной движущей силой демографического роста в Соединенных Штатах с 2000 года. Мексиканцы составляют большую часть латиноамериканского и латиноамериканского населения - 35 758 000 человек. В Соединенных Штатах также проживает большое население Доминиканской Республики , Гватемалы , Колумбии , Гондураса , Испании , Эквадора , Перу , Сальвадора , Никарагуа , Венесуэлы , Аргентины и Панамы . [85] Численность латиноамериканцев, получивших высшее образование, также растет; в 2015 году 40% латиноамериканцев в возрасте 25 лет и старше имели опыт обучения в колледже, но в 2000 году этот процент был на низком уровне — 30%. Среди штатов США в Калифорнии проживает самое большое количество латиноамериканцев. В 2019 году в Калифорнии проживало 15,56 миллиона человек. [51] [86] По состоянию на 2019 год территорией США с наибольшим процентом латиноамериканцев / латиноамериканцев является Пуэрто-Рико (98,9% латиноамериканцев или латиноамериканцев). [50] [24]
Латиноамериканское или латиноамериканское население молодо и быстро растет из-за иммиграции и более высокого уровня рождаемости. [82] На протяжении десятилетий он вносил значительный вклад в рост населения США, и ожидается, что эта тенденция будет продолжаться. Бюро переписи населения прогнозирует, что к 2050 году четверть населения будут составлять латиноамериканцы или латиноамериканцы. [87] [88]
African Americans, or Black Americans, are citizens of the United States with African ancestry.[89] According to the Office of Management and Budget, the grouping includes individuals who self-identify as African American and are descended from Africans that were forcibly relocated to the United States and enslaved, as well as those who recently and voluntarily emigrated from nations in the Caribbean and sub-Saharan Africa.[90] Both groups of people may also identify as Black or some other written-in race. However, some immigrants from the continent of Africa do not identify as Black and are not socially perceived as such, such as the Afrikaners of South Africa.[89] According to the 2009 American Community Survey, there were 38,093,725 Black and African Americans in the United States, representing 12.4% of the population. There were 37,144,530 non-Hispanic Blacks, which comprised 12.1% of the population.[91] According to the 2010 U.S. census, this number increased to 42 million when including multiracial African Americans,[90] making up 13% of the total U.S. population.[a][93] African Americans make up the second largest group in the United States, but the third largest group after White Americans and Hispanic or Latino Americans of any race.[94] The majority of the population (55%) lives in the South, and there has been a decrease of African Americans in the Northeast and Midwest.[93] The U.S. state/territory with the highest percentage of African Americans is the U.S. Virgin Islands (76% African American as of 2010).[25]
Most African Americans are the direct descendants of captives from West Africa, who survived the slavery era within the boundaries of the present United States.[95] The first West Africans were brought to Jamestown, Virginia in 1619. The English settlers treated these captives as indentured servants and released them after a number of years. This practice was gradually replaced by the system of race-based slavery used in the Caribbean.[96] All the American colonies had slavery, but it was usually in the form of personal servants in the North (where 2% of the population were enslaved), and field hands in plantations in the South (where 25% were enslaved);[97] by the beginning of the American Revolutionary War, a fifth of the total population was enslaved.[98] During the revolution, some served in the Continental Army or Continental Navy,[99][100] while others fought for the British Empire in units such as Lord Dunmore's Ethiopian Regiment.[101] By 1804, the states north of the Mason–Dixon line had abolished slavery.[102] However, slavery would persist in the southern states until the end of the American Civil War and the passage of the Thirteenth Amendment.[103] Following the end of the Reconstruction Era, which saw the first African American representation in Congress,[104] African Americans became disenfranchised and subject to Jim Crow laws,[105] legislation that would persist until the passage of the Civil Rights Act of 1964 and Voting Rights Act of 1965 due to the civil rights movement.[106]
According to U.S. Census Bureau data, very few African immigrants self-identify as "African-American" (as "African-American" is usually referring to Blacks with deeply rooted ancestry dating back to the U.S. slave period as discussed in the previous paragraph.) On average, less than 5% of African residents self-reported as "African-American" or "Afro-American" in the 2000 U.S. census. The overwhelming majority of African immigrants (~95%) identified instead with their own respective ethnicities. Self-designation as "African-American" or "Afro-American" was highest among individuals from West Africa (4–9%), and lowest among individuals from Cape Verde, East Africa and Southern Africa (0–4%).[107] Nonetheless, African immigrants often develop very successful professional and business working-relationships with African Americans. Immigrants from some Caribbean, Central American, and South American nations and their descendants may or may not also self-identify with the term "African American".[108]
Recent African immigrants in the United States come from countries such as Jamaica, Haiti, Nigeria, Ethiopia, Dominican Republic, Ghana, Trinidad and Tobago, Kenya, Guyana, and Somalia.[109]
A third significant minority is the Asian American population, which comprised 19.36 million people, or 5.9% of the U.S. population, in 2019.[54] In 2019, 6.12 million Asian Americans lived in California.[51] As of 2019, approximately 532,300 Asians live in Hawaii, forming 37.6% of the islands' people.[50] This makes Hawaii the state with the highest percentage of Asian Americans.[110] Although they were historically first concentrated in Hawaii and the West Coast, Asian Americans now live across the country, living and working in large numbers in New York City, Chicago, Boston, Houston, and other major urban centers. There are also many Asians living in two Pacific U.S. territories (Guam and the Northern Mariana Islands) – as of 2010, Guam's population was 32.2% Asian, and the population of the Northern Mariana Islands was 49.9% Asian.[23]
Филиппинцы проживали на территориях, которые впоследствии стали Соединенными Штатами, с 16 века. В 1635 году «Ост-Индец» внесен в список в Джеймстауне, штат Вирджиния; предшествовало более широкому поселению индийских иммигрантов на Восточном побережье в 1790-х годах и на Западном побережье в 1800-х годах. В 1763 году филиппинцы основали небольшое поселение Сен-Мало, штат Луизиана, после того, как спаслись от жестокого обращения на борту испанских кораблей. Поскольку с ними не было филиппинских женщин, эти «маниламены», как их называли, женились на каджунских и коренных женщинах. Первым японцем, приехавшим в Соединенные Штаты и оставшимся на какой-либо значительный период времени, был Накахама Манджиро, достигший Восточного побережья в 1841 году, а Джозеф Хеко стал первым американцем японского происхождения, натурализованным гражданином США в 1858 году. Как и в случае с новой иммиграцией из центральной части США, и от Восточной Европы до Восточного побережья с середины 19 века, азиаты начали массово иммигрировать в Соединенные Штаты в 19 веке. Эта первая крупная волна иммиграции состояла преимущественно из китайских и японских рабочих, но также включала иммигрантов из Кореи и Южной Азии . Многие иммигранты также прибыли во время и после этого периода с Филиппин , которые были колонией США с 1898 по 1946 год. Законы и политика исключения в значительной степени запрещали и ограничивали азиатскую иммиграцию до 1940-х годов. После того, как США изменили свои иммиграционные законы в 1940-1960-х годах, чтобы облегчить въезд, началась гораздо более крупная новая волна иммиграции из Азии. Сегодня, согласно данным переписи населения, крупнейшими самоидентифицированными подгруппами американцев азиатского происхождения являются американцы китайского происхождения , американцы филиппинского происхождения , американцы индийского происхождения , американцы вьетнамского происхождения , американцы корейского происхождения и американцы японского происхождения , а также другие группы . [111]
Не все предки американцев азиатского происхождения напрямую мигрировали из страны своего происхождения в США. Например, в США проживают более 270 000 человек из Гайаны, южноамериканской страны, но преобладающее число гайанцев имеют индийское происхождение . [112]
Коренные народы Америки , особенно коренные американцы , составляли 2,9% населения в 2020 году, насчитывая 3,7 миллиона человек. Еще 5,9 миллиона человек заявили о своем происхождении частично от американских индейцев или коренных жителей Аляски . [113] Уровни индейского происхождения (в отличие от индейской идентичности ) различаются. Согласно исследованию, в котором использовались данные клиентов 23andMe , геномы афроамериканцев , о которых они сами сообщили, в среднем составляли 0,8% от индейского происхождения, геномы американцев европейского происхождения - в среднем 0,18%, а геномы латиноамериканцев - в среднем 18,0%. [114] [115]
Юридическое и официальное определение того, кто является коренным американцем, на протяжении многих десятилетий вызывало споры среди демографов, племенных народов и правительственных чиновников. Племена, признанные на федеральном уровне, и племена, признанные государством, устанавливают свои собственные требования к членству; для зачисления в племя может потребоваться проживание в резервации, документальное подтверждение прямого происхождения от признанных записей, таких как Роллы Дауэса , и других критериев. Некоторые племена приняли использование количества крови, требуя, чтобы у членов был определенный процент. Федеральное правительство требует, чтобы люди подтверждали количество крови своего происхождения для определенных федеральных программ, таких как льготы на образование, доступные членам признанных племен. Переписчики принимают документы, удостоверяющие личность любого респондента. Ученые- генетики подсчитали, что более пятнадцати миллионов других американцев, включая афроамериканцев и латиноамериканцев (особенно мексиканского происхождения), могут иметь до четверти коренного происхождения. [ нужна цитата ]
Когда-то считалось, что коренные американцы, принадлежащие к многочисленным племенам, находятся на грани исчезновения как расы или культуры, добились возрождения некоторых аспектов своей культуры и на протяжении веков боролись за сохранение суверенитета и контроля над своими делами. В последние годы многие из них начали языковые программы, чтобы возродить использование традиционных языков, основали контролируемые племенами колледжи и другие школы в своих резервациях, а также открыли игровые казино на своей суверенной земле для увеличения доходов для экономического развития, а также для содействия образованию и благосостояния своего народа посредством здравоохранения и строительства улучшенного жилья.
Today, more than 800,000 to one million persons claim Cherokee descent in part or as full-bloods; of these, an estimated 300,000 live in California, 160,000 in Oklahoma (of which a majority are Cherokee Nation citizens), and 15,000 in North Carolina, living in ancestral homelands as members of the Eastern Band of Cherokee Indians.[116]
The second largest tribal group is the Navajo, who call themselves Diné and live on a 16‑million-acre[b] Indian reservation covering northeast Arizona, northwest New Mexico, and southeast Utah. It is home to half of the 450,000 members of the Navajo Nation.[citation needed] The third largest group are the Lakota (Sioux) Nation, with distinct federally recognized tribes located in the states of Minnesota, Nebraska, Montana, Wyoming; and North and South Dakota.[citation needed][clarification needed]
As of the 2020 census, the largest self-identified Native American group not combined with another race is Aztec, numbering 378,122 individuals. Though Aztecs are indigenous to Mexico and not the United States, they are nevertheless considered Native American people per census guidelines, which includes any indigenous people from the Americas.[117][118] Of the 3.2 million Americans who identified as American Indian or Alaska Native alone in 2022, around 45% are of Hispanic or Latino ethnicity, with this number growing as increasing numbers of Indigenous people from Latin American countries immigrate to the US and more Latinos self-identify with indigenous heritage.[119]
Native Hawaiians and other Pacific Islanders numbered approximately 656,400 in 2019, or 0.2% of the population.[54] Additionally, nearly as many individuals identify themselves as having partial Native Hawaiian ancestry, for a total of 829,949 people of full or part Native Hawaiian ancestry.[120] This group constitutes the smallest minority in the United States. More than half identify as "full-blooded", but historically most Native Hawaiians on the island chain of Hawaii are believed to have some Asian and European ancestry.[citation needed]
Some demographers believe that by 2025, the last full-blooded Native Hawaiian will die off, leaving a culturally distinct but racially mixed population.[citation needed] However, throughout Hawaii, they are working to preserve and assert adaptation of Native Hawaiian customs and the Hawaiian language by establishing cultural schools solely for legally Native Hawaiian students and more.
There are significant Pacific Islander populations living in three Pacific U.S. territories (American Samoa, Guam, and the Northern Mariana Islands). As of 2010, American Samoa's population was 92.6% Pacific Islander (mostly Samoan), Guam's population was 49.3% Pacific Islander (mostly Chamorro), and the population of the Northern Mariana Islands was 34.9% Pacific Islander.[22][23] Out of all U.S. states/territories, American Samoa has the highest percentage of Pacific Islanders.[22]
Self-identified multiracial Americans numbered 7.0 million in 2008, or 2.3% of the population.[121] They have identified as any combination of races (White, Black or African American, Asian, American Indian or Alaska Native, Native Hawaiian or other Pacific Islander, and "some other race") and ethnicities.[122] The U.S. has a growing multiracial identity movement.
While the colonies and southern states protected White fathers by making all children born to slave mothers be classified as slaves, regardless of paternity, they also banned miscegenation or interracial marriage, most notably between Whites and Blacks. However, this did little to stop interracial relationships. Demographers state that, due to new waves of immigration, the American people through the early 20th century were mostly multi-ethnic descendants of various immigrant nationalities, who maintained cultural distinctiveness until, over time, assimilation, migration and integration took place.[citation needed] The civil rights movement through the 20th century gained passage of important legislation to enforce constitutional rights of minorities, including multiracial Americans.
The multiracial population that is part White is the largest percentage of the multiracial population. As of the 2000 census, 7,015,017 people self-identified as White/American Indian and Alaskan Native, 737,492 as White/Black, 727,197 as White/Asian, and 125,628 as White/Native Hawaiian and Pacific Islander.[123]
A 2002 study found an average of 18.6% European genetic contribution and 2.7% Native American genetic contribution (with standard errors of 1.5% and 1.4% respectively) in a sample of 232 African Americans.[citation needed] Meanwhile, in a sample of 187 European Americans from State College, Pennsylvania, there was an average of 0.7% West African genetic contribution and 3.2% Native American genetic contribution (with standard errors of 0.9% and 1.6% respectively). Most of the non-European admixture was concentrated in 30% of the sample, with West African admixture ranging from 2 to 20% with an average of 2.3%.[124]
In 1958, Robert Stuckert produced a statistical analysis using historical census data and immigration statistics. He concluded that the growth in the White population could not be attributed solely to births in the White population and immigration from Europe, but was also due to people identifying as White who were partly Black. He concluded that 21% of White Americans had some recent African-American ancestors and that the majority of Americans of known African descent were partly European and not entirely sub-Saharan African.[125]
More recently, many different DNA studies have shown that many African Americans have European admixture, reflecting the long history in this country of the various populations. Proportions of European admixture in African-American DNA have been found in studies to be 17%[126] and between 10.6% and 22.5%.[127] Another recent study found the average to be 21.2%, with a standard error of 1.2%.[124]
The Race, Ethnicity, and Genetics Working Group of the National Human Genome Research Institute notes that "although genetic analyses of large numbers of loci can produce estimates of the percentage of a person's ancestors coming from various continental populations, these estimates may assume a false distinctiveness of the parental populations, since human groups have exchanged mates from local to continental scales throughout history."[128]
In the 2000 census, the non-standard category of "Other"[3] was especially intended to capture responses such as Mestizo and Mulatto,[31] two large multiracial groups in most of the countries of origin of Hispanic and Latino Americans. However, many other responses are captured by the category.
In 2008, 15 million people, nearly five percent of the total U.S. population, were estimated to be "some other race",[121] with 95% of them being Hispanic or Latino.[21]
Due to this category's non-standard status, statistics from government agencies other than the Census Bureau (for example, the Centers for Disease Control's data on vital statistics, or the FBI's crime statistics), but also the Bureau's own official Population Estimates, omit the "some other race" category and include most of the people in this group in the White population, thus including the vast majority (about 90%) of Hispanic and Latino Americans in the White population.[129]
The ancestry of the people of the United States is widely varied and includes descendants of populations from around the world. In addition to its variation, the ancestry of people in the United States is also marked by varying amounts of intermarriage between ethnic and racial groups.
Хотя некоторые американцы могут проследить свою родословную до одной этнической группы или населения в Европе , Африке или Азии , часто это американцы в первом, втором и третьем поколении. Как правило, степень смешанного наследия тем выше, чем дольше предки людей жили в Соединенных Штатах (см. «плавильный котел» ). Существует несколько способов узнать происхождение людей, живущих в Соединенных Штатах, включая генеалогию , генетику , устную и письменную историю , а также анализ графиков федеральной переписи населения ; на практике лишь немногие из них использовались для большей части населения.


В этой таблице показаны все предки, о которых сообщили сами люди , насчитывающие более 50 000 членов, по отдельности или в сочетании, согласно оценкам опроса американского сообщества 2022 года. Общая численность населения США по данным опроса составила 333 287 550 человек, а 251 732 240 человек сообщили о своем происхождении. Из них 175 054 020 сообщили об одном происхождении, а 76 678 224 сообщили о двух или более предках . [130] В латиноамериканских группах не проводится различие между полным и частичным происхождением [131] [132] [133] [134] [135]
However, demographers regard the reported number of English Americans as a statistical error, as the index of inconsistency is high and many, if not most, Americans from English stock have a tendency to identify simply as Americans,[137][138][139][140] or, if of mixed European ancestry, with a different European ethnic group.[62]
These images display frequencies of self-reported ancestries, as of the 2000 U.S. census. Regional African ancestries are not listed, though an African American map has been added from another source.


These images display frequencies of self-reported European American ancestries as of the 2000 U.S. census.


Race and Hispanic origin are two separate concepts in the federal statistical system. People who are Hispanic may be of any race. People in each race group may be either Hispanic or Not Hispanic. Each person has two attributes, their race (or races) and whether or not they are Hispanic.
The Office of Management and Budget is undertaking related mid-decade research for coding and classifying detailed national origins and ethnic groups, and is considering adding a Middle Eastern or North African checkbox in a combined race and ethnicity question. Our consultations with external experts on the Asian community have also suggested Sikh receive a unique code classified under Asian. The Census Bureau does not currently tabulate on religious responses to the race or ethnic questions (e.g., Sikh, Jewish, Catholic, Muslim, Lutheran, etc.).
The researchers found that European-Americans had genomes that were on average 98.6 percent European, .19 percent African, and .18 percent Native American.